Same applies as for the last post. Barron, if you don't think this belongs (and I feel that this belongs less than the previous post) please shift it over to MHHUSH.
I don't know 100% if this is right but it seemed right to me. You have a winrate x bb/100. Your standard deviation per 100 hands is 18. You've played n hands. Your standard error is 18/sqrt(n/100). For the whole sample it is 18*sqrt(n/100). Your BB won is x*(n/100). For 99% confidence you are +/- 3 SD. So your BB won will be x*n/100 - 3*18*sqrt(n/100). Take the derivitive, set to 0, and that is your low point, in terms of hand #, given different x's. Plug in your n to the original formula to find your biggest downswing. I always thought this would require a Markov chain, but the method I just described makes sense to me.
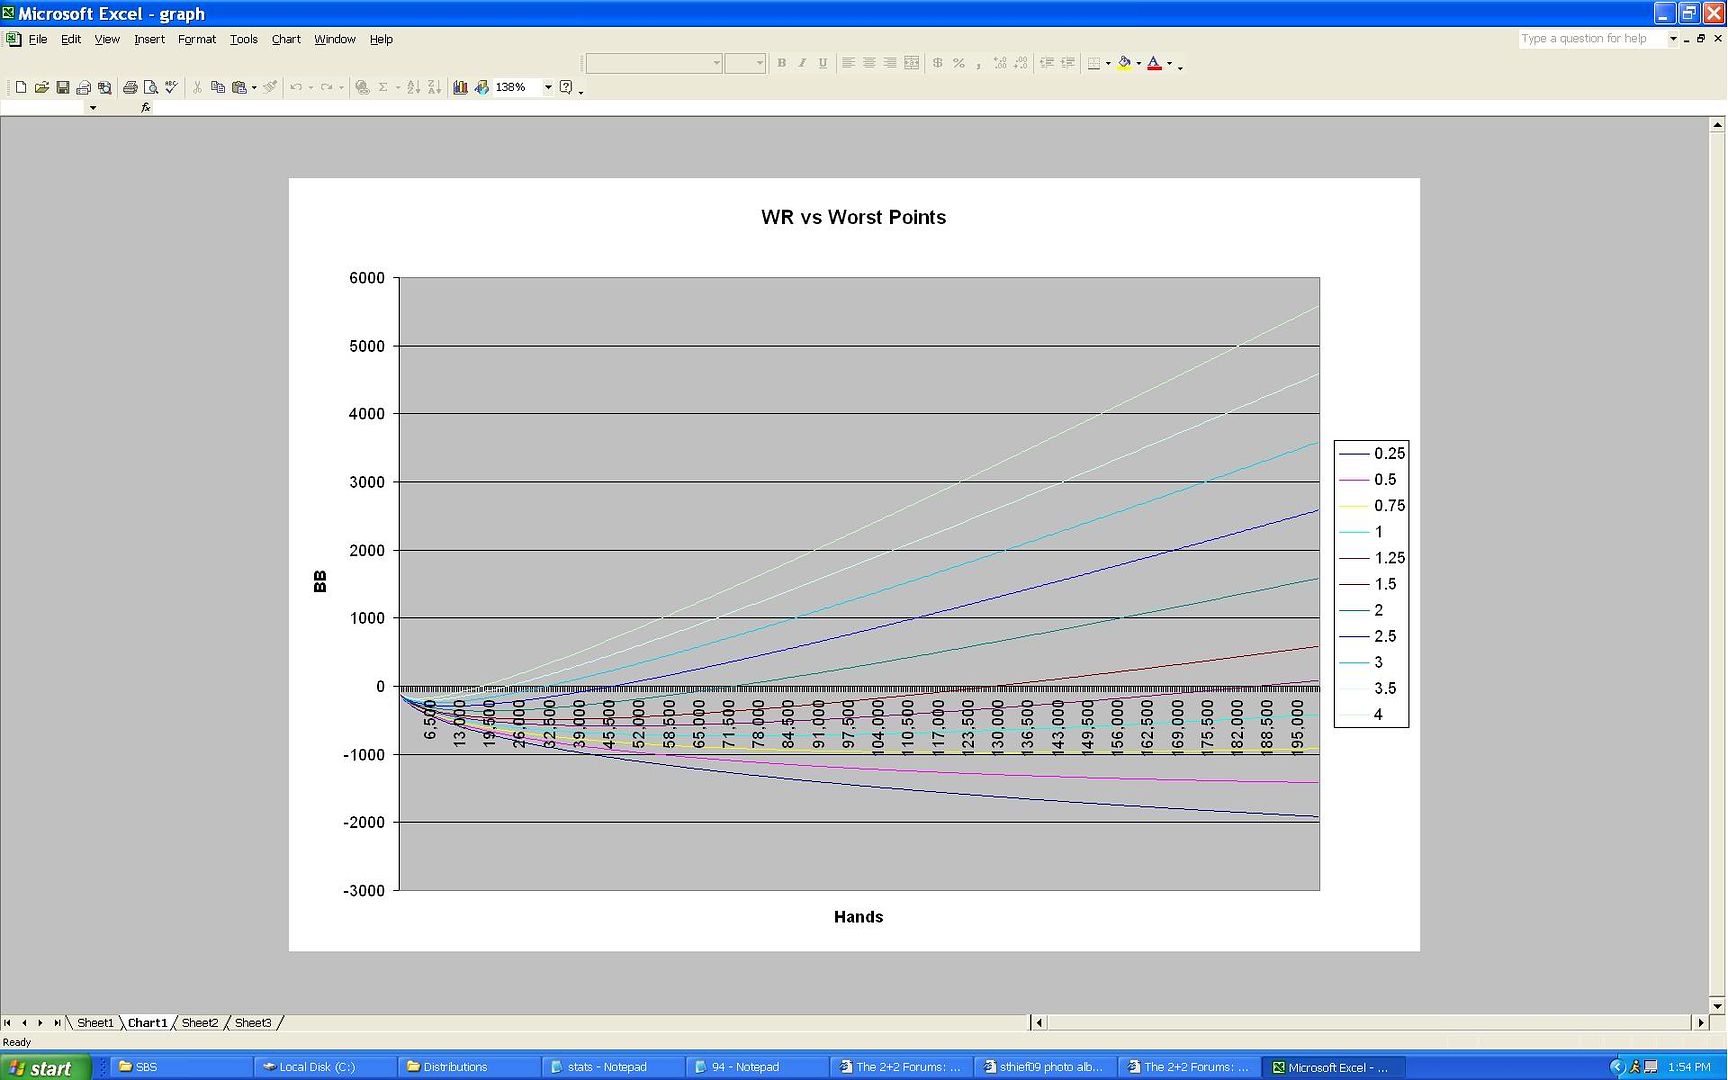
I plugged this into Excel, and came up with the following numbers and graph. The graph represents a plot of what a player's Poker Grapher graph would look like if he ran worse than 99% of players. Pretty interesting I think:
<font class="small">Code:</font><hr /><pre>
Winrate 0.25 0.5 0.75 1 1.25 1.5 2 2.5 3 3.5 4
Biggest Downswing -2,206 -1,458 -972 -729 -583 -486 -364 -292 -243 -208 -182
Biggest Breakeven Stretch 4,665,600 1,166,400 518,400 291,600 186,624 129,600 72,900 46,656 32,400 23,804 18,225
</pre><hr />